What is Earned Value Management (EVM)?
Published: 15-Sep-2025 Updated: 18-Oct-2025
Earned Value Management (EVM) is a proven project control technique that integrates scope, schedule, and cost to objectively measure performance and forecast outcomes. It is widely used in industries such as construction, EPC, and oil & gas to monitor progress and identify potential risks early. By combining planned progress, actual expenditures, and earned value, EVM gives project managers a clear and data-driven picture of how a project is performing.
1. Introduction to Earned Value Management (EVM)
Earned Value Management (EVM) is a systematic method for tracking project performance by combining scope, schedule, and cost into a unified framework. Unlike traditional progress measurement, which often relies on percentage completion or cost alone, EVM provides an objective and quantitative way to evaluate how much value a project has truly earned compared to the planned work and actual expenditures.
The concept of EVM was first developed in the U.S. Department of Defense during the 1960s to strengthen cost and schedule control in defense programs. Today, it is widely applied in engineering, procurement, and construction (EPC) projects, as well as industries like aerospace, IT, and infrastructure. The method’s strength lies in its ability to forecast project outcomes long before problems become visible in schedules or budgets.
At its core, EVM allows project teams to answer three critical questions at any point in the project:
- How much work was planned?
- How much work has been accomplished?
- What did it cost to accomplish that work?
By addressing these questions, project managers gain early warnings of cost overruns, schedule delays, and productivity issues, enabling timely corrective action
2. Key Concepts, Terminology and EVM Formulas
Earned Value Management (EVM) uses a set of standard terms and metrics. These provide a common language for project teams to measure performance and forecast outcomes. Below are the most important concepts:
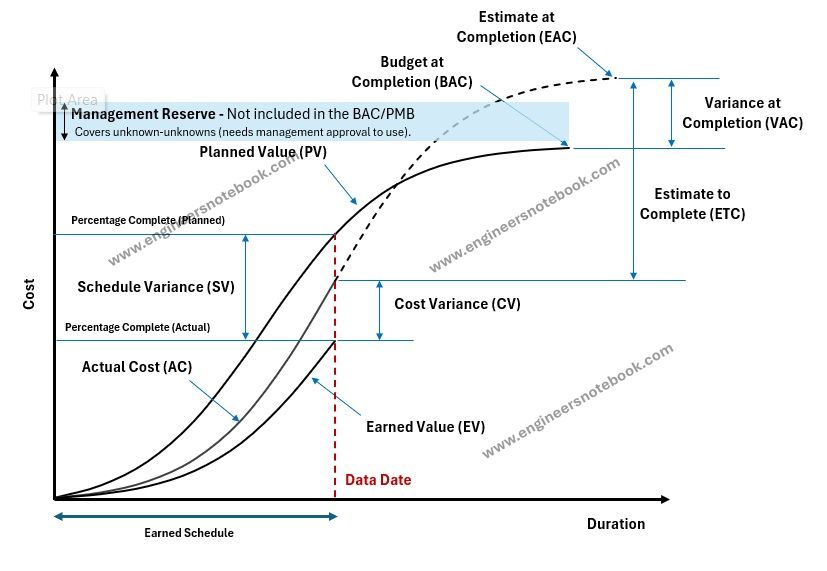
Planned Value (PV):
Also called Budgeted Cost of Work Scheduled (BCWS). This is the budgeted value of the work that should have been completed by a specific date.
Example: By the end of Month 3, a project was planned to achieve $5 million worth of work.
Earned Value (EV):
Also called Budgeted Cost of Work Performed (BCWP). This is the budgeted value of the actual work completed up to a certain point in time.
Example: By Month 3, the project team completed only $4 million worth of planned work.
Actual Cost (AC):
Also called Actual Cost of Work Performed (ACWP). This represents the actual cost spent to accomplish the work completed.
Example: To achieve $4 million worth of work, the project spent $4.5 million.
Budget at Completion (BAC):
The total planned budget for the entire project.
Example: The total EPC contract value is $200 million.
Estimate at Completion (EAC):
The expected total cost of the project, based on current performance.
Example: If productivity remains low, the project may finish at $220 million instead of $200 million.
Estimate to Complete (ETC):
The forecasted cost required to complete all remaining work.
Cost Variance (CV):
The difference between earned value and actual cost (CV = EV – AC). A positive value means under budget, a negative value means over budget.
Schedule Variance (SV):
The difference between earned value and planned value (SV = EV – PV). A positive value means ahead of schedule, a negative value means behind schedule.
Cost Performance Index (CPI):
A ratio of earned value to actual cost (CPI = EV ÷ AC). It shows cost efficiency.
Example: A CPI of 0.9 means the project is only earning 90 cents of value for every $1 spent.
Schedule Performance Index (SPI):
A ratio of earned value to planned value (SPI = EV ÷ PV). It shows schedule efficiency.
Example: An SPI of 0.8 means the project is progressing at only 80% of the planned rate.
These metrics allow project managers to measure both cost and schedule performance in a single framework, making EVM more powerful than traditional tracking methods.
Earned Value Management (EVM) Key Formulas:
Base Figures:
Planned Value (PV) = % of work planned × BAC
Earned Value (EV) = % of work completed × BAC
Actual Cost (AC) = Sum of costs incurred for completed work
Variances:
Cost Variance (CV) = EV – AC or CV=BCWP-ACWP
Schedule Variance (SV) = EV – PV or SV=BCWP-BCWS
- Variance at Completion (VAC) = BAC – EAC
Performance Indices:
Cost Performance Index (CPI) = CPI = EV/AC or CPI = BCWP/ACWP
Schedule Performance Index (SPI) = SPI = EV/PV or SPI = BCWP/BCWS
Estimate at Completion (EAC) = BAC / CPI
EAC – Estimate at Completion
- EAC = AC + (BAC – EV) / 1 Optimistic Method
- EAC = AC + (BAC – EV) / CPI Realistic Method (Based on CPI only)
- EAC = AC + (BAC – EV) / (CPI x SPI) Pessimistic Method (Based on both CPI & SPI)
ETC – Estimate to Complete:
- ETC = (BAC – EV) / 1 Optimistic Method
- ETC = BAC – EV) / CPI Realistic Method (Based on CPI only)
- ETC = (BAC – EV) / (CPI x SPI) Pessimistic Method (Based on both CPI & SPI)
3. Benefits & Limitations of EVM
Benefits of EVM in EPC Projects:
EVM provides early warning of cost overruns and schedule delays, allowing project teams to implement corrective measures promptly. By integrating scope, schedule, and cost, it delivers objective, quantitative metrics like CPI and SPI, reducing reliance on subjective assessments. EVM enhances forecasting, enabling managers to predict final project costs (EAC) and completion timelines accurately. It also improves stakeholder communication by creating a common language of performance, promotes transparency, and supports better resource allocation by identifying inefficiencies.
Limitations and Challenges of EVM:
EVM’s effectiveness depends on accurate and timely data; delays or inaccuracies can lead to misleading metrics. Large EPC projects may face complex implementation, requiring integration between scheduling, cost, and reporting systems. It can be resource-intensive, needing dedicated personnel for data collection and validation. EVM also has limited predictive capability for root causes of variances, and its metrics can be distorted by scope changes or poorly defined work packages. Despite these challenges, when properly applied, EVM provides substantial control, visibility, and predictability for project success.
4. Earned Value Management Across Project Phases
Earned Value Management (EVM) is most valuable when applied systematically across all phases of a project. By integrating cost, schedule, and scope information at each stage, project managers gain early insights and can make informed decisions to keep the project on track.
1. Planning Phase
Purpose: Establish the Performance Measurement Baseline (PMB) by defining scope, schedule, and cost for each Work Breakdown Structure (WBS) element.
EVM Activities:
- Create WBS with cost and schedule estimates
- Assign resources and link costs to activities
- Determine milestones and key deliverables
Example: A construction project defines all major deliverables and allocates budget to each task, forming the baseline against which progress will be measured.
2. Execution Phase
Purpose: Monitor work completion and compare it against the plan.
EVM Activities:
- Measure actual work completed (Earned Value, EV)
- Track Actual Cost (AC) and calculate Cost Performance Index (CPI) and Schedule Performance Index (SPI)
Example: After one month, a highway project reports EV of $500,000 and AC of $480,000. The CPI = 500,000 / 480,000 = 1.04, indicating cost efficiency.
3. Control Phase
Purpose: Take corrective action when variances occur.
EVM Activities:
- Analyze Cost Variance (CV = EV – AC) and Schedule Variance (SV = EV – PV)
- Forecast Estimate at Completion (EAC) and To-Complete Performance Index (TCPI)
- Adjust resources, schedule, or scope to recover variances
Example: A software project detects an SV of -$20,000. By reallocating developers from completed modules, the project recovers the schedule without additional cost.
4. Closing Phase
Purpose: Evaluate overall performance and capture lessons learned.
EVM Activities:
- Compare final EV, AC, and PV against baseline
- Assess CPI and SPI trends for future projects
- Document insights and update organizational process assets
Example: At the end of a bridge construction project, SPI = 1.01 and CPI = 0.98, confirming the project met schedule targets but slightly exceeded costs. Lessons learned guide estimations in the next project.
5. Best Practices and Common Mistakes
Best Practices for Implementing EVM in EPC Projects
Define a Clear Work Breakdown Structure (WBS): Manageable work packages with assigned budgets and schedules ensure accurate measurement of earned value.
Establish Accurate Baselines: Realistic cost and schedule baselines are critical for meaningful metrics.
Integrate EVM into Project Processes: Link EVM with scheduling, cost control, procurement, and reporting to maintain data consistency.
Assign Responsibility: Clear accountability for each work package helps manage scope, schedule, and cost effectively.
Collect and Validate Data Regularly: Timely, accurate progress and cost reporting is essential.
Monitor Key Metrics: Track CV, SV, CPI, and SPI; set thresholds for corrective actions.
Conduct Periodic Performance Reviews: Stakeholder reviews help identify trends, risks, and required adjustments.
Continuous Improvement: Capture lessons learned and refine EVM practices for future projects.
Training and Awareness: Educate all team members on EVM principles and metrics interpretation.
Use Appropriate Tools: Enterprise tools like Primavera P6, SAP PS, EcoSys, or lightweight Excel-based templates depending on project scale.
Common Mistakes to Avoid:
Using inaccurate or delayed data
Treating EVM as a separate reporting exercise
Ignoring scope changes or ambiguous work packages
Following these best practices ensures proactive project control, accurate forecasting, and enhanced stakeholder communication.
6. Case Study: EVM in a Construction/EPC Project
An EPC contractor is constructing a new tankage facility comprising five oil storage tanks, associated piping, and ancillary infrastructure. The project budget is $50M, scheduled over 18 months. By Month 9, the civil foundations, three of the five tanks, and major piping works are partially complete. Management wants to assess project performance using EVM to identify cost and schedule variances and forecast the total completion cost.
Project Data (Month 9):
- Budget at Completion (BAC): $50M
- Planned Value (PV): $25M
- Earned Value (EV): $22M
- Actual Cost (AC): $27M
EVM Calculations:
- Cost Variance (CV):
CV = EV − AC = 22 − 27 = −5M → Over budget
Schedule Variance (SV):
SV = EV − PV = 22 − 25 = −3M → Behind schedule
Cost Performance Index (CPI):
CPI = EV/AC = 22/27 ≈ 0.81 → Low cost efficiency
Schedule Performance Index (SPI):
SPI = EV/PV =22/25 = 0.88 → Behind schedule
Estimate at Completion (EAC):
EAC = BAC/CPI = 50/0.81 ≈ 61.73M → Forecasted total cost
To-Complete Performance Index (TCPI):
TCPI = (BAC−EV)/(BAC−AC) = (50−22)/(50−27) = 28/23 ≈ 1.22
(Indicates that the remaining work must be performed at 22% higher efficiency than current performance to stay within original budget)
7. Conclusion: Why EVM Matters in EPC Projects
Earned Value Management (EVM) transforms project oversight from passive reporting into proactive control. By integrating scope, schedule, and cost, EVM provides quantitative insights that help stakeholders detect deviations early, forecast outcomes, and implement corrective actions.
For greenfield EPC projects, EVM ensures that multi-billion-dollar investments in refineries, LNG terminals, and petrochemical plants are delivered on time and within budget. For brownfield projects, it safeguards critical shutdowns, revamps, and maintenance activities, minimizing financial and operational risks.
When implemented using best practices, supported by the right tools, and aligned with recognized global standards, EVM enhances:
- Predictability: Accurate forecasting of project completion and costs
- Transparency: Clear performance metrics for all stakeholders
- Decision-Making: Data-driven corrective actions and resource allocation
In competitive, high-risk industries like oil and gas, EVM is not optional—it is a project control necessity. It enables project teams to move from reactive problem-solving to strategic performance management, improving the likelihood of project success and maximizing return on investment.